Ever since 2010, the Editorial Board of Kongres Magazine has been presenting fresh and interesting meeting destinations to international meeting planners.
Till this day we have presented 84 Meetologues from 23 destinations. Each destination is evaluated based on 75 different criteria that enable fair comparison of the destinations. Meeting organizers appreciate the expertise, value and practicality of this guide through congress destinations.
The results of 2018 evaluation are presented in detail below.
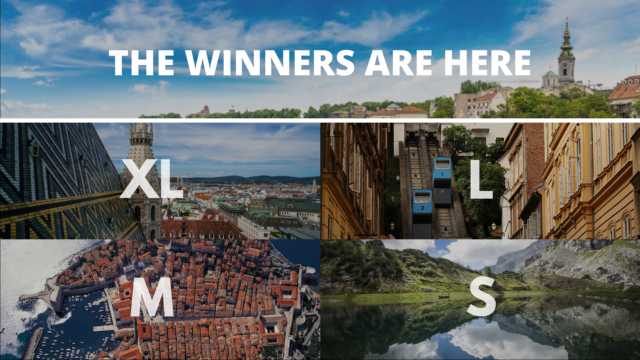
XL MEETING DESTINATIONS
Destinations that can host more than 2,000 congress attendees
- 1. VIENNA 4.77
- 2. ZURICH 4.70
- 3. MÜNICH 4.69
- 4. EDINBURGH 4.63
- 5. BERLIN 4.62
- 6. DUBAI 4.61
- 7. PRAGUE 4.59
- 8. BARCELONA 4.53
- 9. ATHENS 4.51
- 10. LONDON 4.47
SMART MICE CITY
| 4* and 5* hotel rooms | 19,877 |
| 4* and 5* hotels | 189 |
| Destination population | 1,867,960 |
| Banquet hall maximum capacity | 2,500 |
| Largest hall in the city | 55,000 m2 |
| Theatre style hall maximum capacity | 4,320 |
INDIVIDUAL GRADES
| VIENNA INDIVIDUAL GRADES 2018 | |
|---|---|
| Natural and cultural factors: | 4.91 |
| General and transport infrastructure: | 4.98 |
| Tourist infrastructure: | 4.99 |
| Meeting infrastructure: | 5.00 |
| Subjective grade: | 4.91 |
| Marketing Buzz: | 4.77 |
| ICCA index: | 5.00 |
| Numbeo quality of life Index: | 3.87 |
| Numbeo Safety Index: | 4.24 |
| ACI Airport Connectivity Index | 5.00 |
| DESTINATION MARK: | 4.77 |
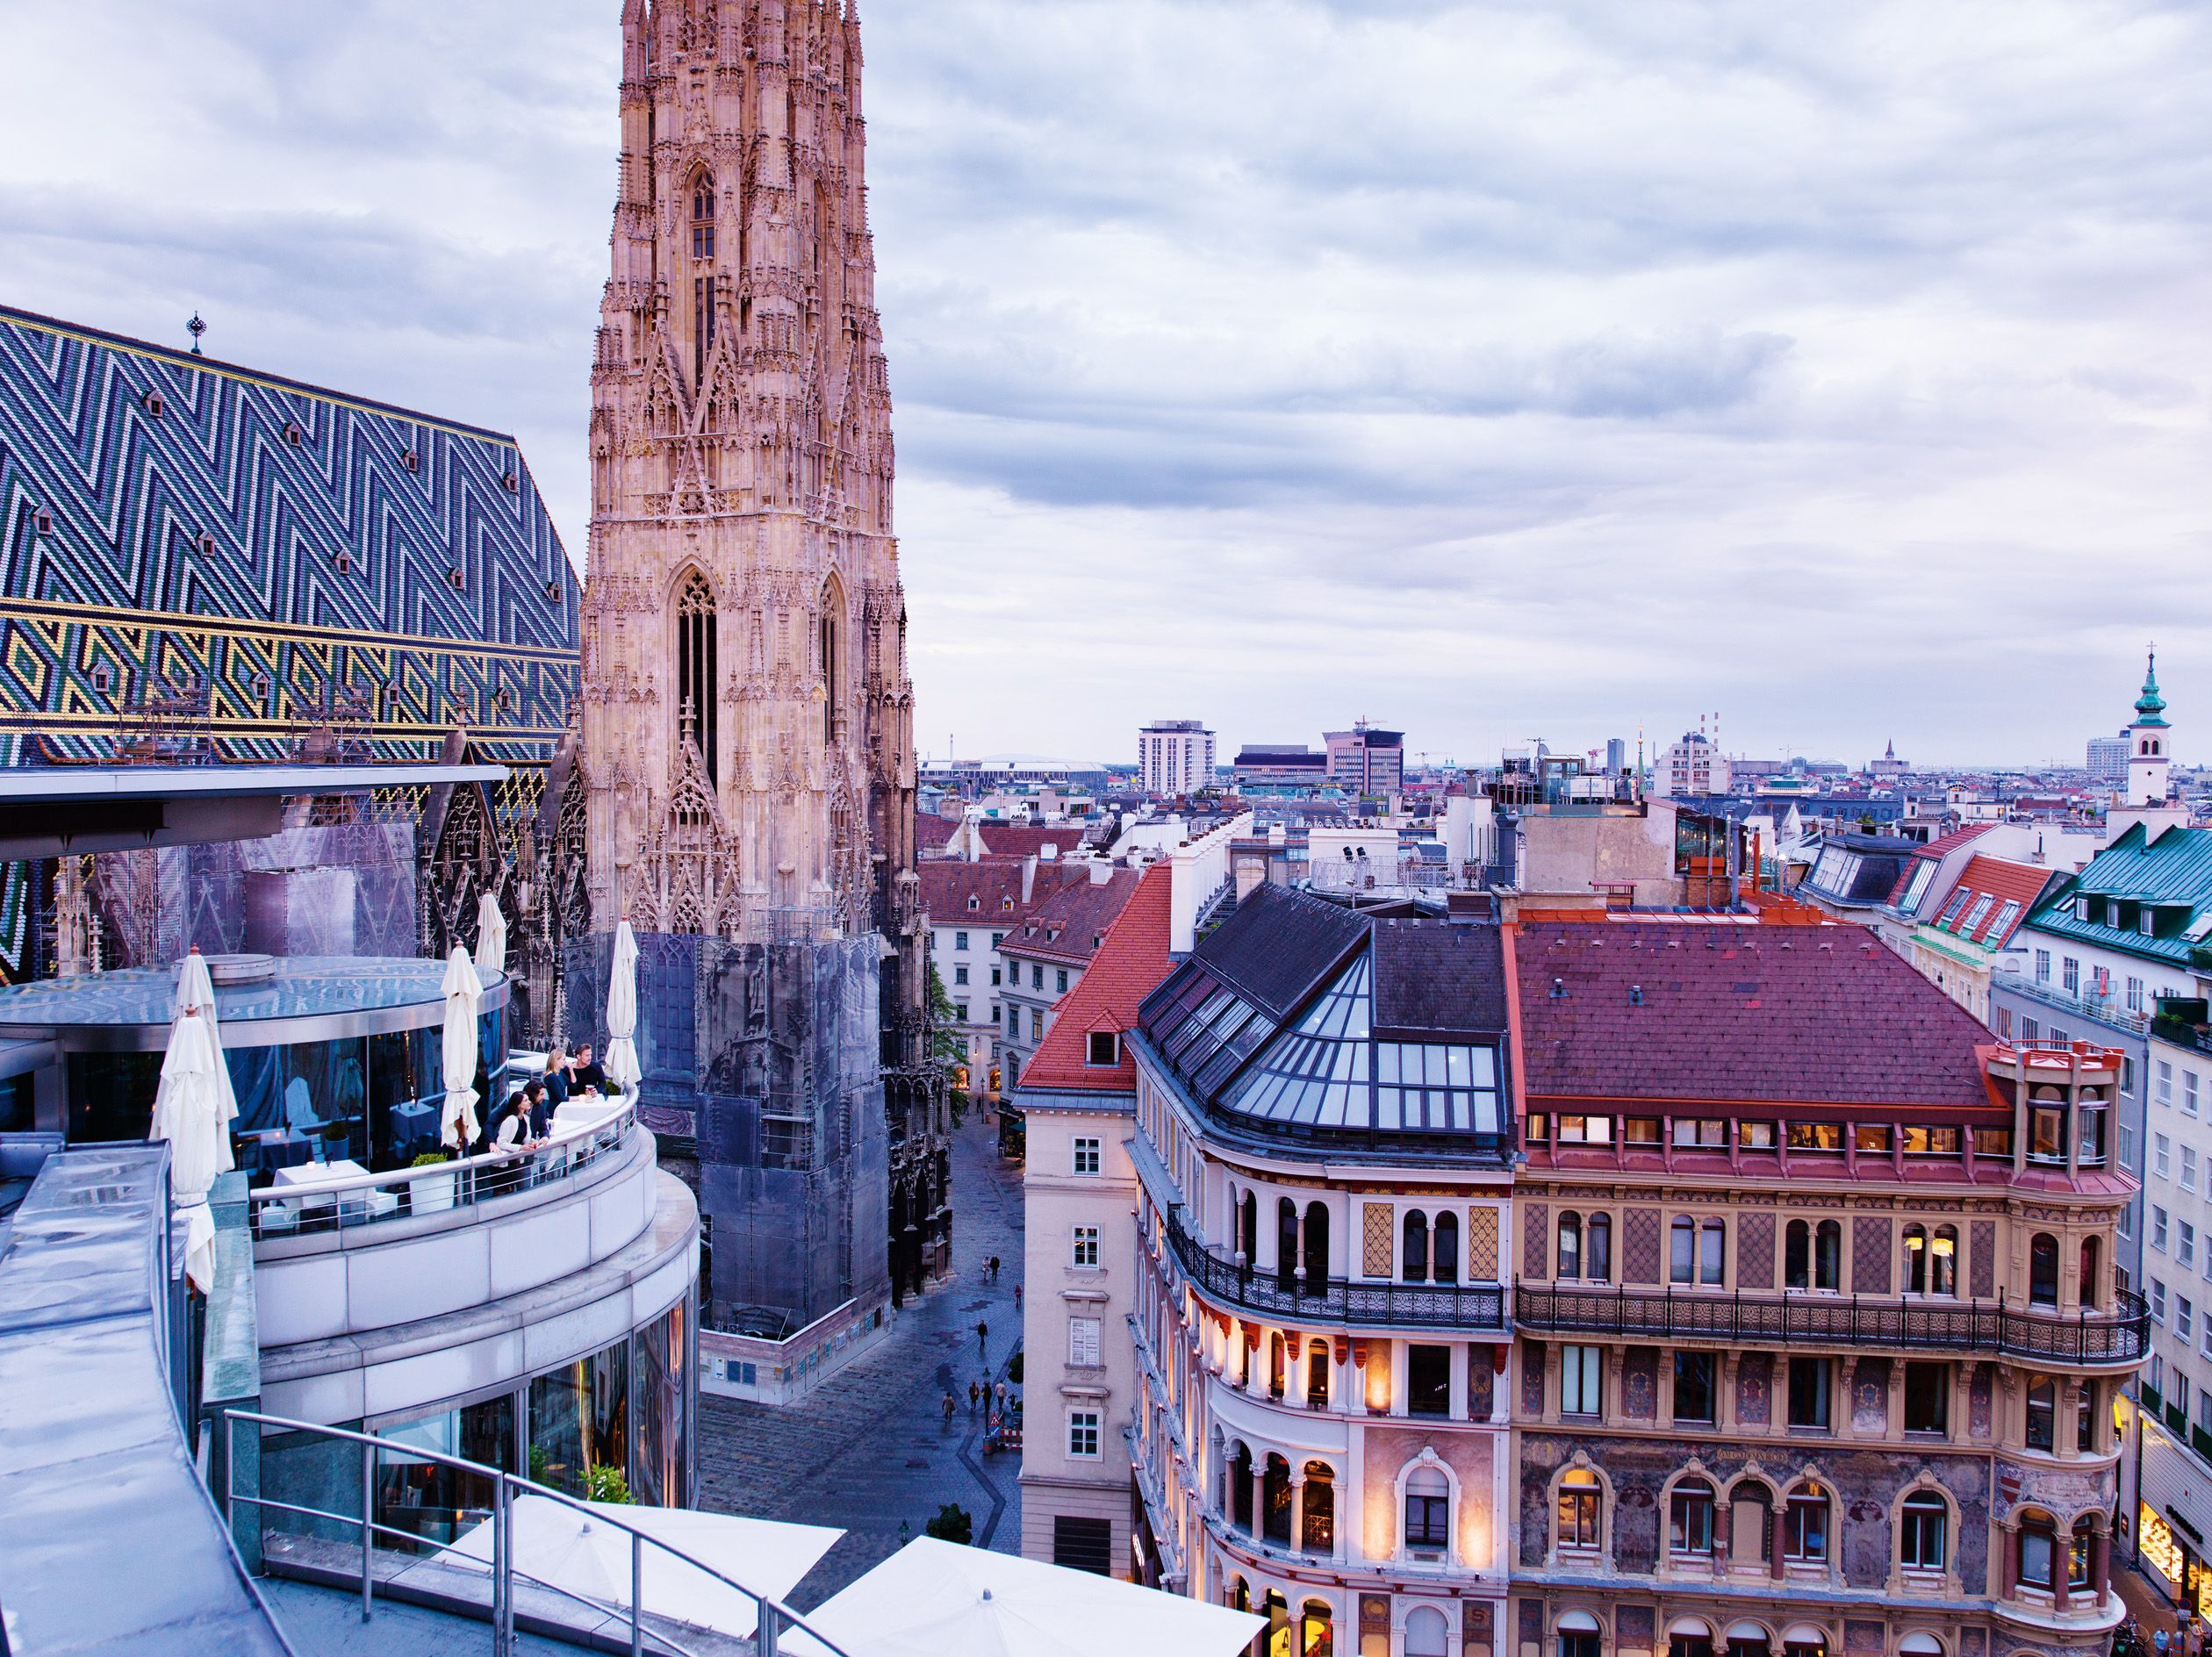
1. VIENNA, AUSTRIA 4.77/5
There are cities in the world which can prove quite stressful for congress participants, and then there is Vienna. From first-hand experience I can confirm that the city is easy to get around, pleasant and enjoyable and already belongs among the so-called ‘smart’ cities of today. Vienna’s city authorities are convinced that the ‘smart’ city can grow whilst at the same time reducing the use of natural resources. One of the crucial initiatives is the intensive inclusion of the city’s residents, since there is a desire that innovations help improve living standards for all. It is all this that places Vienna among the smart cities of the future and makes it an excellent meeting destination.
L MEETING DESTINATIONS
Destinations that can host up to 2,000 congress attendees
- 1. ZAGREB 4.37
- 2. TALLINN 4.36
- 3. LJUBLJANA 4.35
- 4. GRAZ 4.34
- 5. VENICE 4.31
- 6. SALZBURG 4.29
- 7. KRAKOW 4.23
- 8. BRATISLAVA 4.18
- 9. VILNIUS 4.17
- 10. INNSBRUCK 4.13
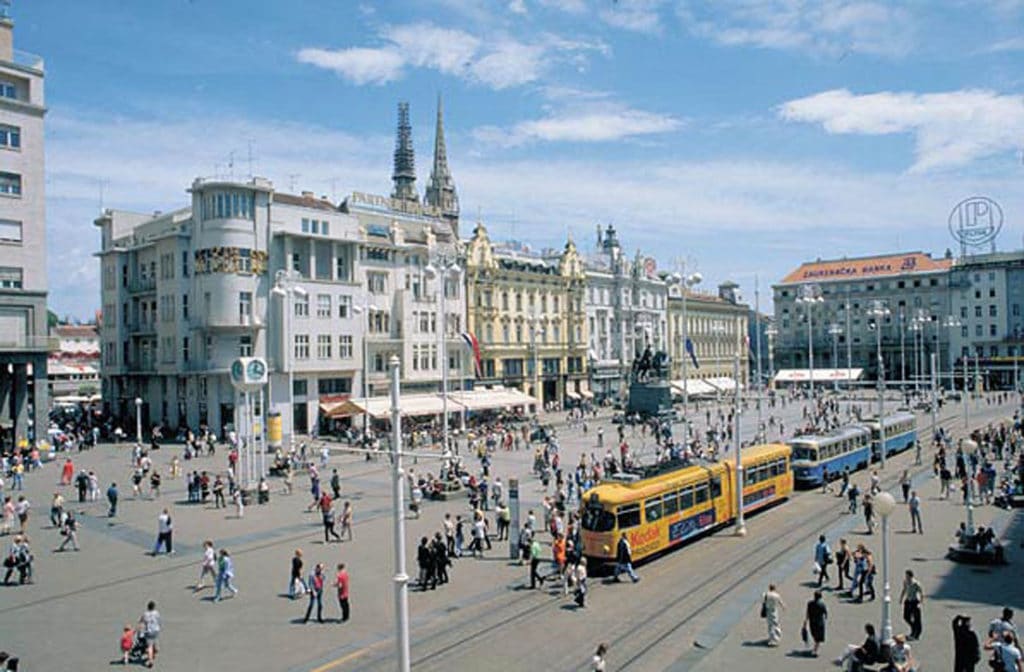
WHITE ZAGREB TOWN
| 4* and 5* hotel rooms | 2,666 |
| 4* and 5* hotels | 20 |
| Destination population | 799,556 |
| Banquet hall maximum capacity | 1,600 |
| Largest hall in the city | 2,360 m2 |
| Theatre style hall maximum capacity | 1,851 |
INDIVIDUAL GRADES
| ZAGREB INDIVIDUAL GRADES 2018 | |
|---|---|
| Natural and cultural factors: | 4.78 |
| General and transport infrastructure: | 4.83 |
| Tourist infrastructure: | 4.82 |
| Meeting infrastructure: | 4.80 |
| Subjective grade: | 4.79 |
| Marketing Buzz: | 4.42 |
| ICCA index: | 4.32 |
| Numbeo quality of life Index: | 3.17 |
| Numbeo Safety Index: | 4.11 |
| ACI Airport Connectivity Index | 3.70 |
| DESTINATION MARK: | 4.37 |
1. ZAGREB, CROATIA 4.37/5
It can be said that Zagreb has a great congress future. As well as Belgrade, Zagreb is also progressing steadily on the chart of development meetings destinations; the final breakthrough of the intire region is intertwined and dependent on the marketing of mayor regional congress cities in the international market. In the last ten years Croatia has radically improved road infrastructure and thus its accessibility. Significantly improved is also air accessibility via Zagreb Airport, which accepts over 40 % of all air traffic in Croatia. The hotel infrastructure with new acquisitions fully satisfies modern congress guests and is perhaps at this moment the best among regional capitals. Zagreb is a pocket-friendly destination that offers a lot for reasonable money.
M MEETING DESTINATIONS
Destinations that can host up to 1,200 congress attendees
- 1. DUBROVNIK 4,33
- 2. VILLACH 4,13
- 3. KLAGENFURT 4,12
- 4. SPLIT 4,11
- 5. ŠIBENIK 4,03
- 5. BLED 4,03
- 6. SCHLADMING 4,02
- 7. OPATIJA 4,01
- 8. PORTOROSE 3,98
- 9. ROVINJ 3,97
- 10. POREČ 3,93
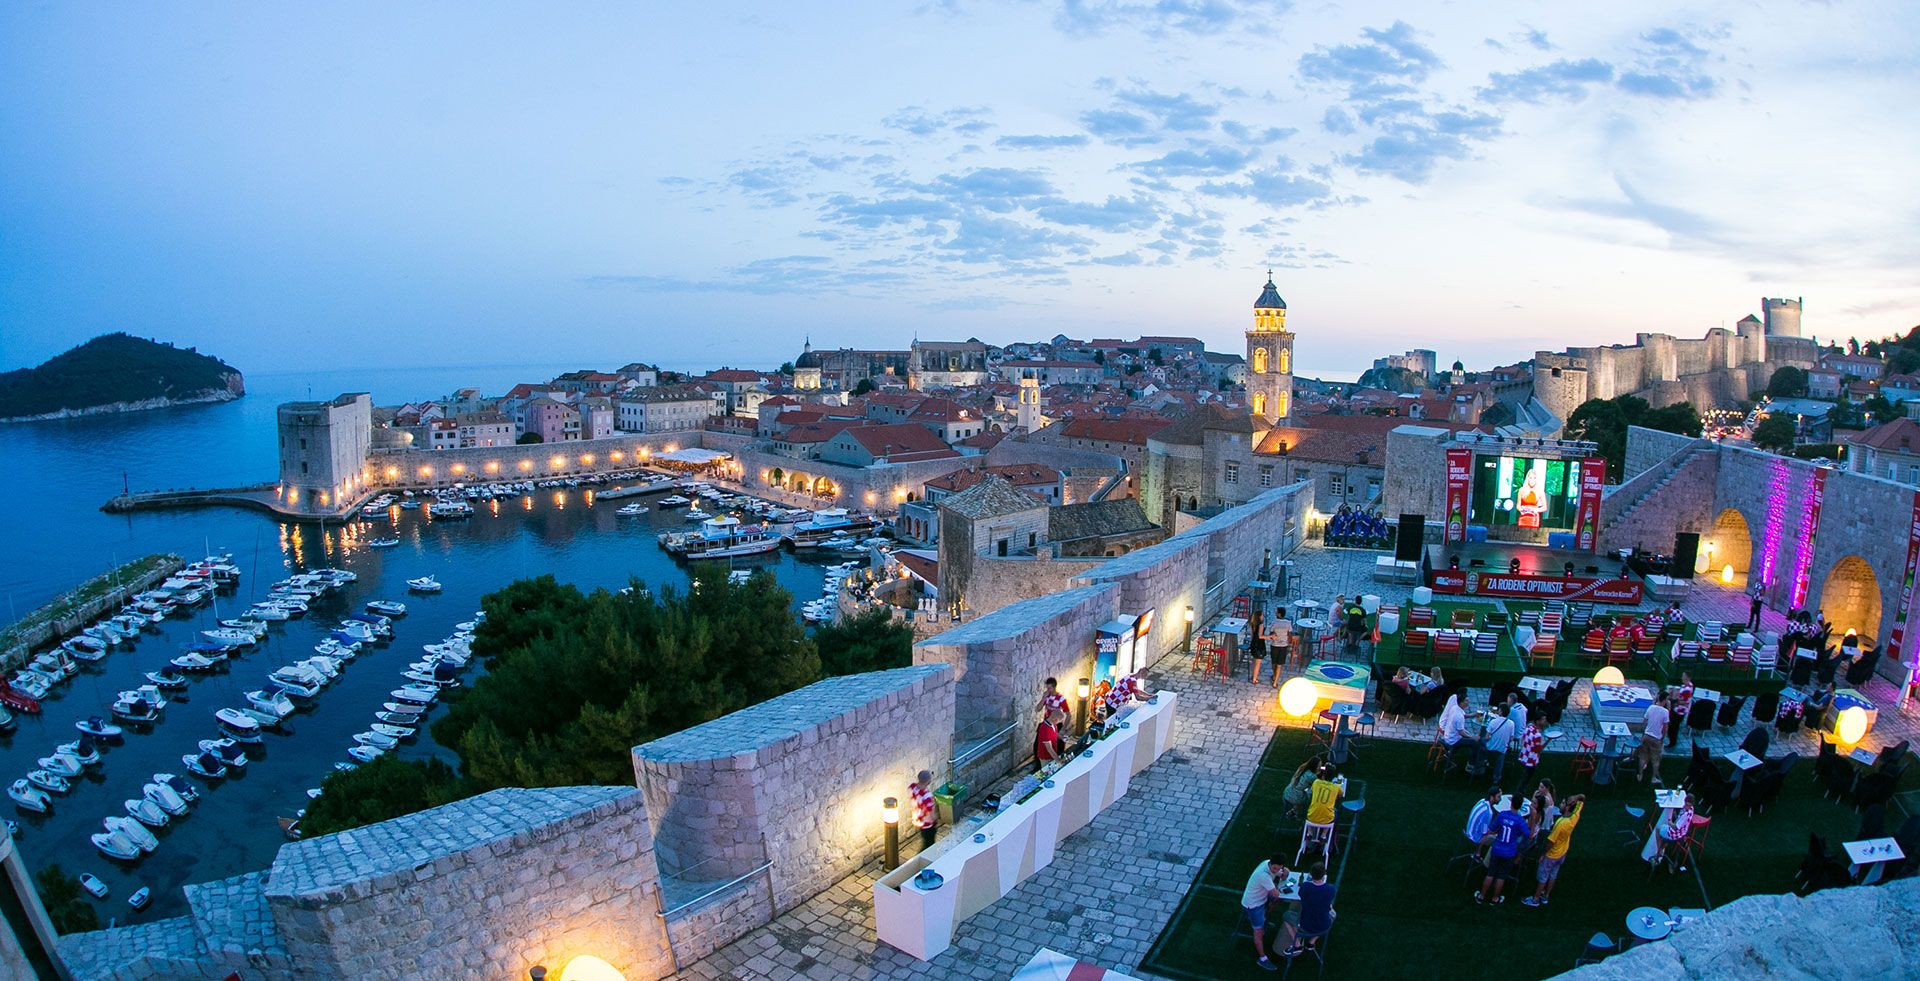
PEARL OF THE ADRIATIC
| 4* and 5* hotel rooms | 4,165 |
| 4* and 5* hotels | 29 |
| Destination population | 42,615 |
| Banquet hall maximum capacity | 700 |
| Largest hall in the city | 900 m2 |
| Theatre style hall maximum capacity | 1,200 |
INDIVIDUAL GRADES
| DUBROVNIK INDIVIDUAL GRADES 2018 | |
|---|---|
| Natural and cultural factors: | 4.95 |
| General and transport infrastructure: | 4.61 |
| Tourist infrastructure: | 4.91 |
| Meeting infrastructure: | 4.81 |
| Subjective grade: | 4.84 |
| Marketing Buzz: | 4.41 |
| ICCA index: | 3.95 |
| Numbeo quality of life Index: | 3.22 |
| Numbeo Safety Index: | 4.75 |
| ACI Airport Connectivity Index | 2.89 |
| DESTINATION MARK: | 4.33 |
1. DUBROVNIK, CROATIA 4.33/5
Dubrovnik is the flagship of regional tourism and is commonly the first association of meetings organizers we meet daily. It is the closest in the region to renowned Mediterranean convention destinations Cannes and Monte Carlo, and it will be even closer after the completion of the convention center. So far the center is successfully replaced by modern and well-equipped centers at hotels such as Dubrovnik Palace, Excelsior, Bellevue, Grand Villa Argentina, Importanne Resort, Dubrovnik President, Valamar Lacroma and Radisson Blue. Well-developed is the entire conference infrastructure including destination management and creative agency scene. The city is safe and one of the tourist icons of the Adriatic and justifiably the most painted tourist skyline with unprecedented experiential diversity for conference guests.
S MEETING DESTINATIONS
Destinations that can host up to 500 congress attendees
- 1. NASSFELD HERMAGOR 4,05
- 2. BAD KLEINKIRCHEIM 4,02
- 3. GORIŠKA BRDA 3,87
- 4. HVAR 3,85
- 5. KRANJSKA GORA 3,84
- 6. MALI LOŠINJ 3,82
- 6. BOHINJ 3,82
- 7. SOČA VALLEY 3,81
- 8. LAŠKO 3,78
- 9. PODČETRTEK 3,77
- 10. UMAG 3,76
IN THE HEART OF ALPS

| 4* and 5* hotel rooms | 500 |
| 4* and 5* hotels | 25 |
| Destination population | 18,435 |
| Banquet hall maximum capacity | 190 |
| Largest hall in the city | 340 m2 |
| Theatre style hall maximum capacity | 250 |
INDIVIDUAL GRADES
| NASSFELD INDIVIDUAL GRADES 2018 | |
|---|---|
| Natural and cultural factors: | 4.74 |
| General and transport infrastructure: | 4.62 |
| Tourist infrastructure: | 4.49 |
| Meeting infrastructure: | 4.43 |
| Subjective grade: | 4.69 |
| Marketing Buzz: | 4.23 |
| ICCA index: | 1.02 |
| Numbeo quality of life Index: | 4.68 |
| Numbeo Safety Index: | 4.91 |
| ACI Airport Connectivity Index | 2.72 |
| DESTINATION MARK: | 4.05 |
1. NASSFELD HERMAGOR, AUSTRIA 4.05/5
In the last couple of years, the tourist offer of Nassfeld has seen some big investments. More than 26 million euros have been put into the Nassfeld ski resort (together with Pressegger See) in the last two years. The four valleys on the austro-italian border offer 110 kilometers of ski slopes, with 30 modern ski lifts ensuring smooth connections between them. Nassfeld is also famous for its high number of sunshine hours, as the protective effect of the Hohe Tauern mountain range blesses the town with the most sun in the region. This means that there are plenty of options for incentive and team building programmes in nature throughout the year. Natural conditions and a high quality of hotel accomodation positions Nassfeld among the most attractive incentive destinations in Central Europe.
HOW TO EVALUATE AND DEFINE ‘THE BEST’
FROM Meeting planners, FOR Meeting planners
Key to MTLG evaluation criteria 2018
Every year the editorial board of Kongres magazine aims to further refine the Meetologue methodology in order to assure the most authentic score reflecting the genuine situation of destinations.
Destination evaluations are based on thorough analyses of different criteria. They have developed from interviews and surveys with over 1,200 event organisers from across Europe, work that showed us that destinations are comparable and helped us to form a unique model of evaluation. A mixture of factors that we have been evaluating since 2010 can affect the entire meeting experience for both meeting planners and participants.
Main groups of criteria that have been divided into subgroups:
A. Natural and cultural factors
1. Natural diversity
2. Climate and Weather
3. Social environment
4. Cultural heritage
5. Natural experience index
6. Historical sites
7. Architecture
8. Accessibility to nature
9. Sustainability satisfaction
10. Quality of ecosystem
B. General and transport infrastructure
1. Destination safety
2. Accessibility — road
3. Accessibility — air
4. Accessibility — rail
5. General public services
6. Airport
7. Public transport
8. Financial institutions
9. Internet access
10. Pollution index
C. Tourist infrastructure
1. Restaurant scene
2. Variety of bars and coffee shops
3. Nightlife
4. Leisure activities
5. Adrenaline activities
6. Sports activities
7. Shopping
8. Fun parks, casinos
9. Theatres, musical venues, cinemas
10. Tourist information system
D. Meetings infrastructure
1. History and references
2. Variety of meeting suppliers
3. Quality of meeting hotels
4. Convention and exhibition centres
5. Ratio of 4 and 5***** hotel rooms
6. Incentive programmes
7. Professionalism of meetings industry
8. Diversity of offer
9. Effective convention bureau activities
10. Support services
E. Subjective grade
1. Political stability
2. Security ratings
3. General support to meetings industry
4. Cost/Value
5. Destination competitiveness
6. Personal experience
7. Local hospitality
8. E-services
9. Business climate
10. Destination image
F. Marketing buzz
1. Destination brand perception
2. Brand and corporate identity of CVB
3. New or innovative
4. Destination advertising
5. Direct communication
6. Digital communication
7. Mobile communication
8. Content marketing
9. Events
10. Social network and community
With different destinations we evaluate over 75 criteria that are described in detail below. They form the final destination grade or the ‘MEETINGS EXPERIENCE INDEX’, as we like to call it. The best destinations are annually recognised on the main stage of the Conventa Trade Show.
A. Natural and cultural factors
Factors that are vital for the development of the meetings industry, because events are usually focussed on the more appealing destinations. We grade everything from regional diversity, climate conditions and social attractiveness to architecture, historical sites and the attitude towards continual development of the market. The whole picture gives us an image of the diversity of a destination and is an important criteria for its attractiveness.

B. General and transport infrastructure
This includes analytic assessment of infrastructure and public realm tidiness, which reflects the quality of living for residents and consequently also for congress guests. In this section we test everything from destination safety to road, air and rail connections. Other important criteria include public infrastructure, the network of financial institutions, internet access and a healthy and respectful attitude towards the environment.
C. Tourist infrastructure
Without appropriate tourist infrastructure, the development of congress tourism is nearly impossible. The assessment shows if there is an appropriate quality and accessibility of hotel capacity, restaurants, cafes and nightlife. We also grade the recreational/sport offer as a basis for incentive programmes. On top of that, the cultural offer, tourist information and destination management are also given full assessment.
D. Meetings infrastructure
For many, the most important part is grading the congress capacity. In this section we evaluate the standard palette of congress providers, congress hotels, congress centres, exhibition centres and focus on their quality. We want to know the number of appropriate 4 and 5 star hotel room providers and, above all, that the incentive offer, business attitude and professionalism of congress providers is supportive of congress services and the activities of their local convention bureau.
E. Subjective grade
Within the remit of subjective grading are a number of combined criteria that include political stability, destination safety and the attitude taken to congress tourism. We also assess the ratio between quality and price, the competitiveness of the destinaton, local hospitality and the destination’s overall image. A lot of this boils down to the personal experience of the assessors.
F. Marketing buzz
Despite impressively fulfilling the other criteria, proactive marketing can be the element that sorts the good from the great. This is why we assess the development of the entire marketing infrastructure in the field of direct, digital, social and traditional marketing.
After evaluation, the destinations are then assigned one of five categories as follows:
- 5 excellent meetings destination
- 4 quality meetings destination
- 3 recommendable meetings destination
- 2 average meetings destination
- 1 so-so
MTLG 2018 - FAQ
We have collected the answers to some of the most common questions you are asking us about the Meetologues. If you do not find an answer to your question, ask us a new question. We will be happy to answer it.
How do you really evaluate individual destinations?
The destinations are evaluated on the basis of field work done by one of our journalists and thorough research of individual criteria, in order to get as close as possible to the real situation. In addition, we are committed to reality, verifiability and objectivity. Every year we review and re-evaluate the destinations according to the new information that the destination representatives provide.
How did you get the idea of preparing congress travel?
We dare to state that we were the first who developed the new journalistic genre of congressional travel journals – Meetologues, in which we discover new congress destinations based on extensive field research. In doing so, we try to write without “unnecessary luggage”. We want to get closer to objective situations, so our reporters use a special matrix, which we named the Congressional Destination Index. This is a reference system that we are using from the beginning and allows a real comparison of the destinations over time.
Why do we need congressional travel and destination assessment?
Congressional travelogues or Meetologues have become a strong reference point over the past decade for decision makers as well as for the event organizers, when choosing the destinations for their events, especially because of the Meetologues’ logic and the benefits they bring to all of the stakeholders. However, we are convinced that our evaluations are objective and helpful to event organizers, while at the same time they are a helpful tool for enabling destinations to improve in areas where the current situation is different from the competition.
Why is the evaluation important for the destinations?
Our evaluation is primarily a tool for improving the competitiveness of individual destinations. It offers an outward look at their destination with the aim of continually improving and achieving excellence. As this is a systematic and contingent process, the progress of the individual evaluated criteria can be monitored over time. Destinations use our methodology primarily because they want to become or remain worldly competitive.
What differs MTLG from the other evaluation scales?
It is a systematic, structured and analytical process that covers a number of factors, which are defined as important by event organizers. We dare to state that this is the most complex assessment of destinations, which is not based solely on the number of congress events in the destination, but is analytically much deeper. We are proud that our methodology triggers positive changes in destinations and has become a standard.
Why do you use different destination categories (XL, L, M and S destinations)?
Over 90 destinations from the wider region of New Europe are covered in the categorization and evaluation. With the help of different categories, we enable event organizers to choose a destination that suits their needs. Therefore, the category is more guided by what kind of event the individual destination is able to host from a logistical point of view and the general capacity that it offers. Our categorization includes a combination of criteria, the sum of evaluation points of indexes is the basis for classifying destinations into four categories.
What does the term New Europe mean?
The MTLGs were the first to introduce to the international markets the countries of South-Eastern, Central and Eastern Europe through convention programs, which we often rank in NEW EUROPE. Before, with the term New Europe, all the countries of Eastern Europe or the former Eastern bloc were described. Despite numerous stereotypes, the region boasts exceptional conditions for congress tourism: stunning history, rich cultural and historical heritage, excellent accessibility, affordable acceptance. Many new congress centers and hotels and creative solutions make the NEW EUROPE a fresh and desirable congress destinations.
What does the ACI index refer to?
Using the SEO NetScan connectivity model, the report provides indexes for direct, indirect and hub connectivity based on both quantitative and qualitative metrics. The airport connectivity index is made-up of both direct and indirect weekly frequencies, weighted by their quality. This means that this is not simply a measure of how many city pairs there are, or how many direct services there are. For the purposes of this report, connectivity is a composite measure of the number of destinations, the frequency of services and the quality of the connections (in the case of hubbing or indirect services).
You can check for further details at the following link.
Why do you use Numbeo index for several evaluations?
Because Numbeo is the largest online database, that does not depend on the media or the lobbies, and is co-created by portal visitors. Above all, we use it because we checked the Numbeo data in the filed and we found out that the data reflected the actual situation as well. And also because the value of the methodology was recognized by the world’s largest media. We are also proud that the idea originated in the Balkans. The author of the methodology is the genius former Google engineer Mladen Adamovic from Serbia.
Are you checking the Numbeo indices in the field?
In order to ensure that all data for individual destinations is actually checked in the field, and in case of major deviations, we also adapt accordingly.
What methodology do you use to evaluate Sustainable measures?
Here we come from the Purity and Cleanliness assessment in Prague, Czech Republic, which in our opinion very accurately defines how far the city is in this area. In Prague, for example, the total index is 568.67, while in Vienna it is 672.63, while in Ljubljana it is 643.57.
How do you evaluate the “Perception on sustainability” criteria?
This grade is connected to Numbeo Purity and Cleanliness index by Numbeo, but equipped with actual measures that destinations need to take in this field.
How do you evaluate “Public transport” criteria?
We also evaluate this criterion on the basis of Numbeo indexes (https://www.numbeo.com/traffic). If we take Prague and Vienna for example, the index for Prague for example in this segment is 110.37, whereas Vienna has an index of 75.17- the lower the index, the higher a destination positions. A similar difference is seen when comparing C02 emissions, which is 2206 in Prague and 1412 in Vienna.
Why is the ICCA ranking part of the evaluation?
It is the only such annual statistical report in the congressional segment that has more than 50 years history of data captured. We are aware of the shortcomings of the ICCA survey, since it does not cover all the events taking place at destinations, and does not cover corporate or economic-business and intergovernmental meetings and motivational trips, which represent an important part of the global meeting industry. For this reason, the ICCA index is only one of the criteria, but it does give a great deal of indication of the maturity of individual congress destinations.
How is the ICCA index calculated?
The final results for the current year are ranked according to the grade from 1 to 5. Specifically, the first and the second ranked destinations on the ICCA ranking get the scores 5, destinations that are ranked below 320 places get a score 1.02.
How can we independently check the quality of each rating?
We already upgraded the entire methodology last year with the benchmarking system, which we perform for individual congress destinations and we named it MTLG BENCHMARK. With our methodology, we save you a lot of valuable time, which you would otherwise have spent on comparing it with your main competitors.

The evaluation process is conducted in two-stages:
- 1. SELF-EVALUATION OF THE DESTINATION based on the method of congressional MTLGs
At this stage, destinations are evaluated according to all the criteria that are covered by our methodology and include 63 competitive criteria. On the basis of self-evaluation, a comparative matrix is prepared, which is the basis for the Benchmark workshop in the second phase. - 2. BENCHMARK WORKSHOP with key stakeholders at the destination
The workshop is aimed at assessing the competitive advantages and disadvantages of the destination and the exchange of good practices regarding the further development of the destination.
How do you rate the Tourist Information Centers?
This grade is based on actual visits to your information centers.
How do you assess the professionalism of the meetings industry?
This segment grades the responsiveness and professionalism of individual providers and is checked through actual RFP’s and offers. I could probably write an entire book about it, so if you have any questions I will gladly give you some more information. I believe this segment carries the biggest room for improvement.
How did you calculate the carrying capacity of individual congress destinations?
The complexity of the meetings industry means there are many possible variables that can contribute to defining the ‘size’ of a destination. We have been looking for those that are frequently considered to be closely connected and interdependent. This aspect of the defining criteria process necessitated a review of existing literature, which is quite limited in that field and is heavily reliant on the statistics prepared by the international association ICCA, which focuses on recording the number of association meetings and their participants at a destination. Our pillar capacity of meeting estimations were calculated based on criteria that were defined with the help of leading experts from various destinations and are as follows:
1. Air accessibility of destinations
This assessment is based on the European air connectivity report, which is prepared annually by ACI Europe. Analysing connectivity data from the SEO Economic Research’s ‘Netscan’ connectivity model, the report provides in-depth insights into how well Europe is connected by air, both internally and with other regions in the world. It distinguishes between direct and indirect connectivity, and takes a special in-depth look at the dynamics at Europe’s hubs – which act as engines of connectivity for wider outreach.
2. The number of 4* and 5* category hotel rooms
The development of meeting destination is directly linked to the number of hotel rooms it has, which according to our study reaches at least twice the maximum capacity of the plenary hall at the destination. The single use of rooms is dominated by congress guests and for business tourism, which includes the meetings industry, the use of rooms in the business categories of 4 and 5 stars is predominant. For that reason, only those hotels are assessed in this category.
3. The number of 4* and 5* category hotels
To enhance destination comparisons, we also captured the number of 4 and 5 star category hotels that are predominantly used by congress guests. The number of such hotels is a unique indicator of how well a destination is adapted to business tourism and vice versa.
4. Banquet hall maximum capacity
Practically every congress or event also plays host to a social event or a gala dinner. It is often the case that the maximum capacity of the hall for banquets dictates the maximum size of the congress that the destination is able to accommodate. This criterion is therefore extremely important to our assessment.
5. The largest hall in the city in square meters
The size of the hall further dictates the size of the largest events and accompanying exhibitions that can ordinarily accompany such events. These are normally the multifunctional halls in congress and exhibition centres. This criterion is directly linked to exhibition activity, which is most highly developed in the so-called ‘meeting hubs’.
6. Maximum hall capacity in theatre layout
Congress centre halls that are suitable for plenary sessions are assessed in this category. To make this a level assessment many sports facilities were excluded, as they typically lack the additional infrastructure required for the organisation of events.
7. Population
A city or a town’s population tends to be the catalyst for development, transformation and, of course, also the generator of many events. Over the course of history the meetings industry has developed in the urban regions and is therefore considered one of the factors associated with metropolitanisation and the major conurbations in Europe.


